Qlik associative engine
What differentiates it from others?
The context
The Qlik associative engine is what drives Qlik products under its hood. The way that the engine is constructed, enables fast calculations on large and complicated data models. That sounds great and all, but first of what does it even mean associative in this context?
associative adjective
1. relating to the association of ideas or things
• making associative links
2. (mathematics) giving the same result no matter in what order the parts of a problem are done, for example (a × b) × c = a × (b × c)
The mechanics of Qlik's engine relate to both meanings of this definition. On one hand we have many interconnected data objects, with their respective indexing to provide the neccesary speed, on the other hand the engine makes sure that the values stay true no matter what is the context they are placed in.
An interconnected microcosmos of data
In the associative model, all data points are interconnected and have their respective relationships between each other. This allows to store data separately, with a guideline between separate tables. Thanks to the provided link between the data, there is a possibility to connect infomation, which is not neccesarily directly related to one another.
An example of a simple interconnected data model of product sales:
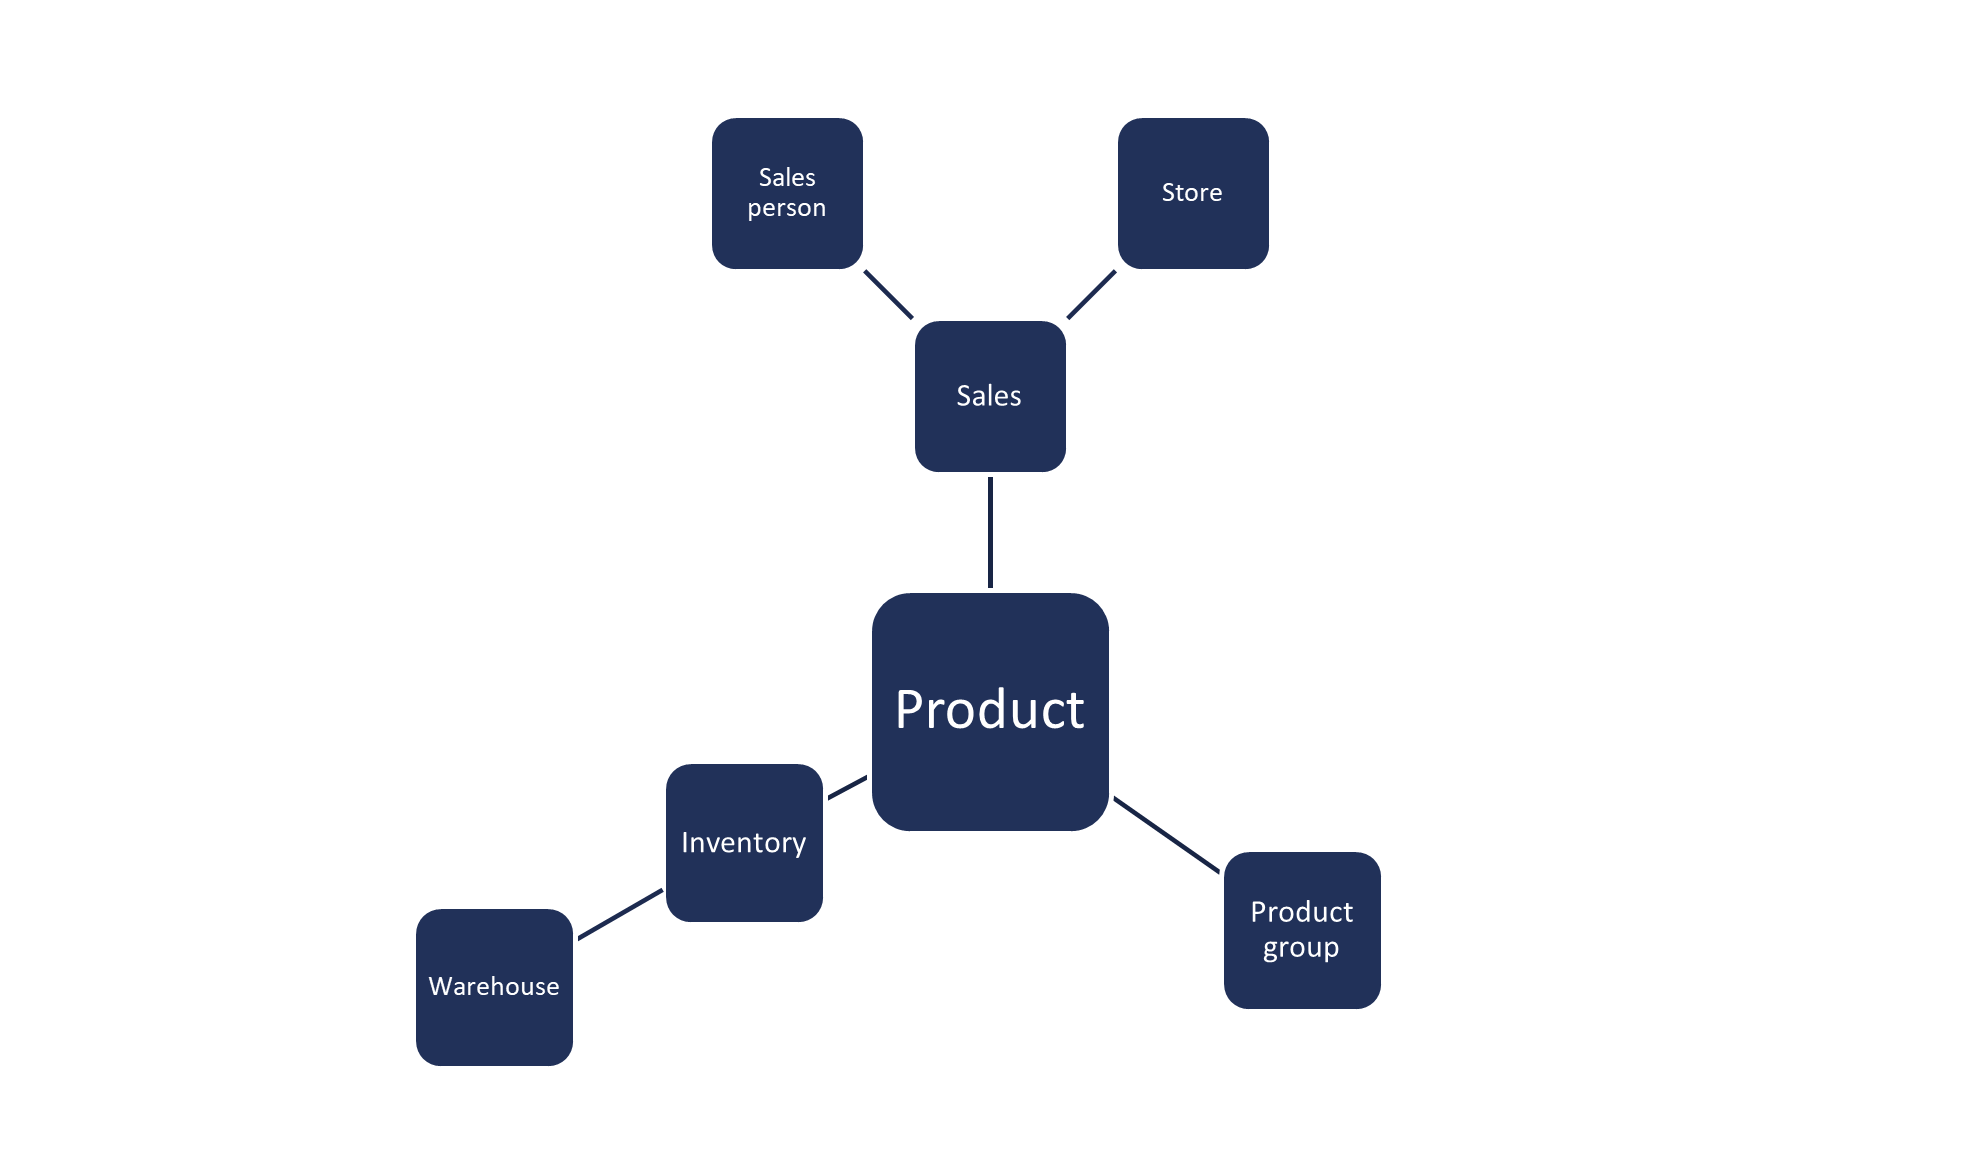
In the above example, nothing stops us of making a list of Warehouse inventory by Sales persons date of birth. While this would probably make not much sense, thanks to the associations provided, although this two informations are not connected directly, Qlik "knows" how they relate to one another. This gives us a lot of benefits:
- Load multiple data sets at one place - have more information in one report without the neccesity to create a separate report for a separate set of data
- Easly filter data - because all data is associated, the engine can filter out unrelated data from across all data
- No queries are made - all of the data is available straight away, and is dynamically reached whenever needed
- Speed - calculations even on very large data sets are performed fast
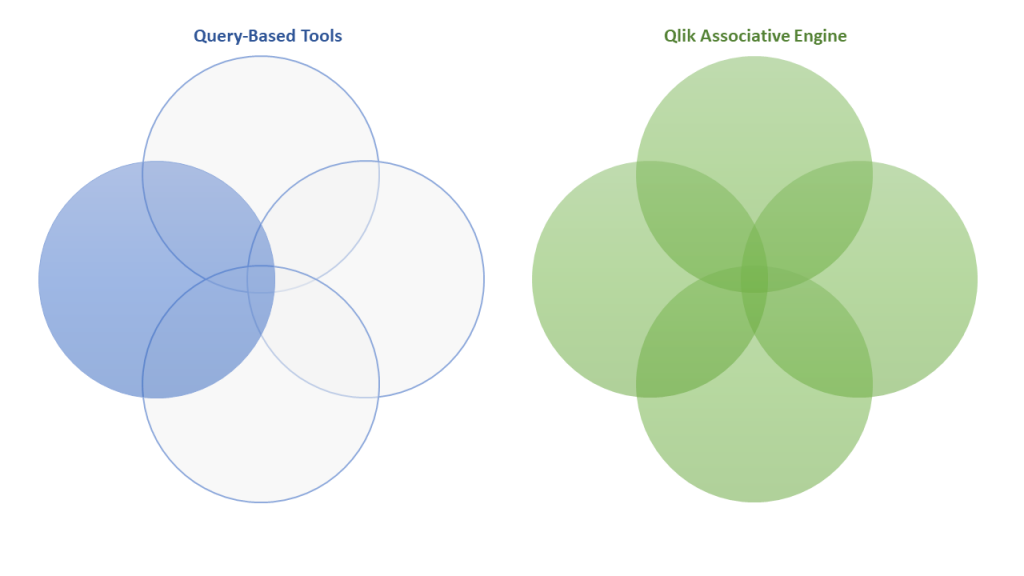
How it compares to the traditional data model
The associative model may be hard to understand at first glance especially for people used to excel and databases, as these tools require to have a strictly defined row of data. It can be briefly summed up as:
Query tools - ask, wait, answer. Load a specific subset of data.
Qlik associative engine - load everything, have all needed data at hand, the engine takes care of efficient use of resources to maintain speed.
In order to query across multiple tables inside of a database, you need to join the data on the way to receive it in the desired format. This has worked wonders for decades, however in the ever increasing datasets of the 21st century, it's becoming more and more hard to perform, especially when there isn't a simple way to do a one-to-one connection. The database model requires to do some precalculation and/or preagregation to simplify the data to a unified row.
Inside of Qlik, the preagregation and precalculation is not a must (it's there, just as optional phase). Thanks to that you can work seamleslly on a sum of milion rows, and a second later drill down into specific records of the same data.
Qlik was founded in 1993 in Lund, Sweden. The first product was named "QuikView", which was later renamed to QlikView.
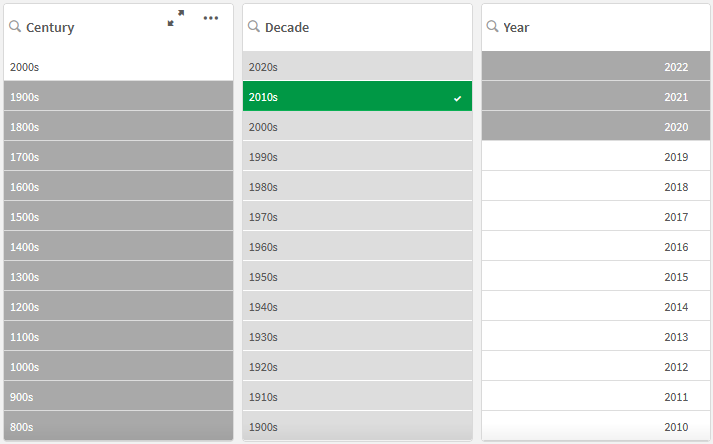
"The power of Grey"
Whenever making selections/filtering inside of Qlik, you don't see only the selected options, but also marked in two shades of grey - alternative values (light grey), and unrelated values (dark grey).
As pictured below, only the 2010s decade is selected, and you can instantly see what are the other possible, and other non-related values. It's logical, that 2010s blong to the 2000s century. Years belonging to the 2010s are possible to select (white) and years unrelated to 2010s are marked in dark grey.
This gives additional insight on values you'd expect, or don't expect in a given range. Imagine a situation when you select the current Year and Month, and a given Sales person is marked as dark grey - that'd mean that there weren't any sales related to that person in this period:
- It may be a data higene issue,
- It may be that this person no longer works, and therefore it's what you'd expect and everything is ok,
- It may be that this person works, everything is ok with the data, and therefore it's a crucial piece of information to look deeper into.
And that's just thanks to making one selection.