Why 2 + 2 is not always = 4
And why it makes perfect sense
Phaedrus / Plato
The what and why
It may become confusing at first sight, but it's actually pretty common in the realm of Business Intelligence. The whole root cause is coming from how is the data structured - when data is organized in a "flat" table, the aggregation of information across multiple tables can yield unexpected results.
The Complexity Unveiled
Let's consider a simple scenario: a company selling three different products to three different customers. Pretty simple, right?
Initially, this data seems straightforward. We can visualize such sales in multiple ways, lets choose to do a simple pivot table, which shows the Customers in sequential rows, and the Products they purchased in the columns.

Up until this point everything makes perfect sense, and there's no issue whatsoever.
Now lets complicate things ever so slightly
Now to spice things up, we'll add each customer a tag. Each customer can receive multiple tags - similarly as they can purchase from a variety of products.
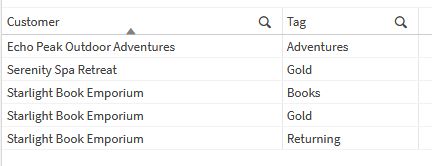
Complications arise since each customer is assigned multiple tags, introducing a one-to-many relationship between tags and customers. Integrating sales data with customer tags may present a challenge, resulting in duplicated values and unexpected totals—a phenomenon akin to the pitfalls of a Left Join operation in traditional SQL.
As we now have a relation of one to many in the context of Tags to customers - if we would want to connect the sales with the customers and the tags at the same time - we'd occur a problem, as the values would get duplicated if not properly taken care of, as shown in the table below - we can see that the Sales are being repeated, which we may or may not want to happen.

Wait a minute... 25+68+82+68=107?! Why the total at the top doesn't add up to the sum of rows?
This is a regular question from anybody coming from excel, as in the face of these challenges, Qlik's brilliance shines through which may be surprising at first sight. Unlike conventional spreadsheets or query languages, Qlik doesn't naively sum rows to derive totals. Instead, it provides a nuanced understanding of the data's intricacies.
Consider the case of "Starlight Book Emporium," the lone customer with multiple tags. We know that objectively just by attaching multiple Tags to a customer, it doesn't magically increase the amount of business that we have with them (we can only dream for it to be as be simple as that in real life). Qlik recognizes that duplicating sales figures across tags doesn't accurately reflect the true business volume. Instead, it offers various approaches to handle such scenarios, ranging from equitable distribution of sales to selective tagging strategies.
So which is true, the rows, or the summary at the top?
Actually - both are true in their own way, we just need to understand the data and how to look at it.
The beauty of Qlik lies in its adaptability to diverse use cases. Whether it's maintaining data integrity, creating hierarchies, or exploring alternative tagging strategies, Qlik empowers users to tailor their analyses to specific business needs. With each change in dimensions or data drill-down, Qlik dynamically recalculates values, ensuring accuracy and consistency across the board.
The only customer that had multiple tags is "Starlight Book Emporium". We know that it had total Sales of 68, and since this customer is occurring in three different tags, his sale of 68 is repeated in all of the tags, as we didn't "tell" the data model to do something else. Depending on what we want to achieve we could:
- Leave it as is
- Divide the sales equally between the tags - the customer with multiple tags would have their Sales divided of 68 divided equally to 22.66(6) between the three tags respectively.
- Show the sales only at the first tag of any given customer
- Create a hierarchy of tags, in which one would be worth more than the other and receive the sales respectively
- Tag the products instead of the customers
- etc etc.
It all depends on the specific use case, but the possibilites are there, and Qlik does the underlying math whenever you change the dimensions or drill down the data, adjusting the values at every change on the grid to reflect the changes.
Conclusion
In the intricate landscape of BI, Qlik stands as a beacon of clarity amidst complexity. By unraveling the mysteries of data aggregation and interpretation, Qlik empowers businesses to make informed decisions, transforming raw data into actionable insights. So, the next time 2 + 2 doesn't equal 4 in your BI reports, remember—it's not a mistake; it's a revelation waiting to be explored with Qlik.
Qlik publishes new major releases quarterly naming them by the month and year of release (e.g. February 2024). Asides for that, patches and bug fixes are provided on a regular basis.