Qlik Sense vs Power BI
A brief comparison of the most popular Business Intelligence tools
Introduction
Two very similar tools, with the same purpose in mind, but with seemingly small differences that may turn out to be crucial when creating a whole reporting environment for an organization.
The market is definitely overrun by Power BI, which has been a very popular solution in the recent years. Geographically speaking, Qlik is more popular in Europe (especially in the Nordic Countries as it originates in Sweden), while Power BI has a stronger customer base in the United States and Asia. The global business intelligence tools market share percentage varies strongly from source to source, but in most of them we can see, that Power BI has at least double the market in comparison to Qlik.
Business Intelligence market share in 2021:
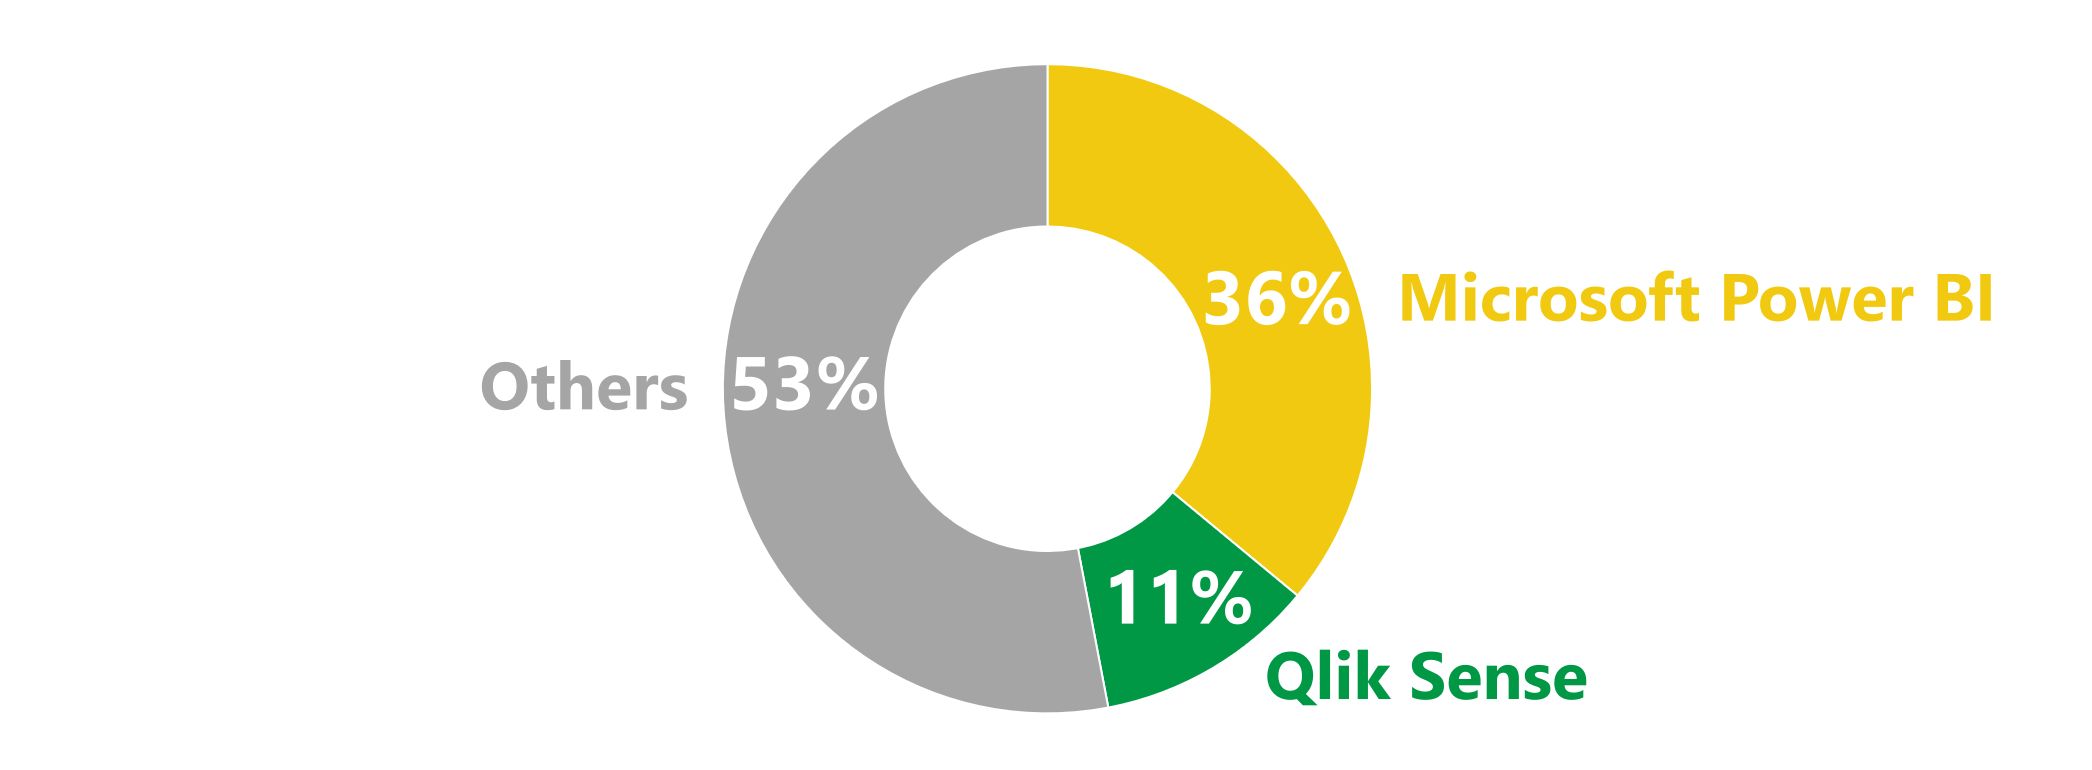
source: https://www.trustradius.com/vendor-blog/business-intelligence-statistics-and-trends
Report Development cycle
Starting of with the first large difference, the development cycle for both applications is a little different.
Power BI requires a somewhat two step process, where you first develop a report inside of Desktop application (Power BI Desktop) and when you're finished you later publish the application into Power BI Service. While the Power BI Service covers a large portion of the functionality as the desktop application, it's not fully the same. It gives a possibility to modify part of the visuals, but not the full process of creating a complicated report from scratch. Whenever creating a new report, or editing a report which requires change in the data source or more complicated formulas - you first download the report file to the desktop application, make the changes there and later publish it when finished. It's not a huge inconvenience, however it can be a pain e.g. when working on multiple reports requiring small changes.
Qlik Sense does also offer a desktop application, but its fully optional in the development cycle - all of the functionality is in one place on the server running the Qlik Sense environment. While the desktop app has all the functionality, since the server-side covers all the needs, the desktop app mostly is used for tests.
The difference in running everything on server-side vs partially on the desktop-side also means, that for Power BI you need to have a machine capable of running the desktop application at a reasonable speed. This will come as more important in the "Speed" and "Costs" sections.
Speed
Here is where Qlik truly shines above all other Business Intelligence applications.
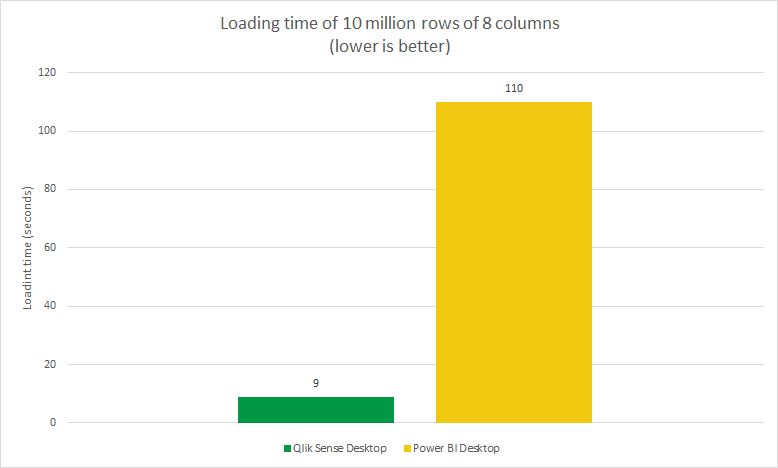
We've prepared a simple scenario in which there are 10 million records in a "flat" table stored inside a CSV file. To make the test fair, in both cases we're loading the data via a desktop application, on the exact same machine. It takes Power BI desktop 1:50 minutes to load the data, while Qlik Sense required 9 seconds that's 12x faster.
This difference in speed further increases when the data requires some further transformation on the way. What's crucial - the current workflow for Power BI requires to use the desktop application, which means running it on older machines will be significantly requiring more patience.
What's important though, the difference in speed is not noticeable when the data is already loaded - making selections and filters is running very similar in both applications, so from the end-user point of view it doesn't really matter (especially as they'll mostly run it from the server-side anyway). So the difference in speed regards mostly to people creating and modifying the reports.
Ok so Qlik is 12x faster when loading 10m records, but that's only a minute here and there, that doesn't really matter, right? Wrong. Imagine how many times you need to extract, load and transform the data before reaching the desired output. The example above uses just 10 million records of a flat datasource, the difference is further highlighted when working with 100 million records, or e.g. joining, and transforming a couple tables. In a relatively simple example, if you load the application 15 times before the data looks like you'd expect, in the same scenario of 10 million records, we're talking about a difference of 25 minutes. For 100 million records that'd well above 4 hours.
This difference in speed changes the way you work. Imagine a excel file, that whenever you make a change in a formula, you have to wait 2 minutes before the sheet recalculates, you instantly disable the dynamic calculations into on-demand, to lessen the pain, but whenever you need to hit F9 to calculate, you go and do something else since the machine freezes. That's what's working with a large dataset on Power BI feels like. With Qlik you rather work fully dynamic.
As a side-note, the speed for Qlik can be further increased by storing the data in a format native for Qlik - .qvd files take around 20-30% less time to load in comparison to .csv files.
Costs
Nowadays, software companies try to squeeze out the dollars out of customers in multiple complicated ways, so when talking about the costs, we'll be taking into consideration what's called a "Total Cost of Ownership".
The licensing model:
Straight of the bat, Power BI Desktop is a free application downloadable from the Microsoft Store. That's a great marketing move that wins a lot of points to Microsoft (wouldn't it be great if other Microsoft applications had a similar price-model?).
Then we get a free version of Power BI Service for one user (which is also a great marketing move) and after we've tested everything out for free, when we're ready we can choose from a couple of pricing options:
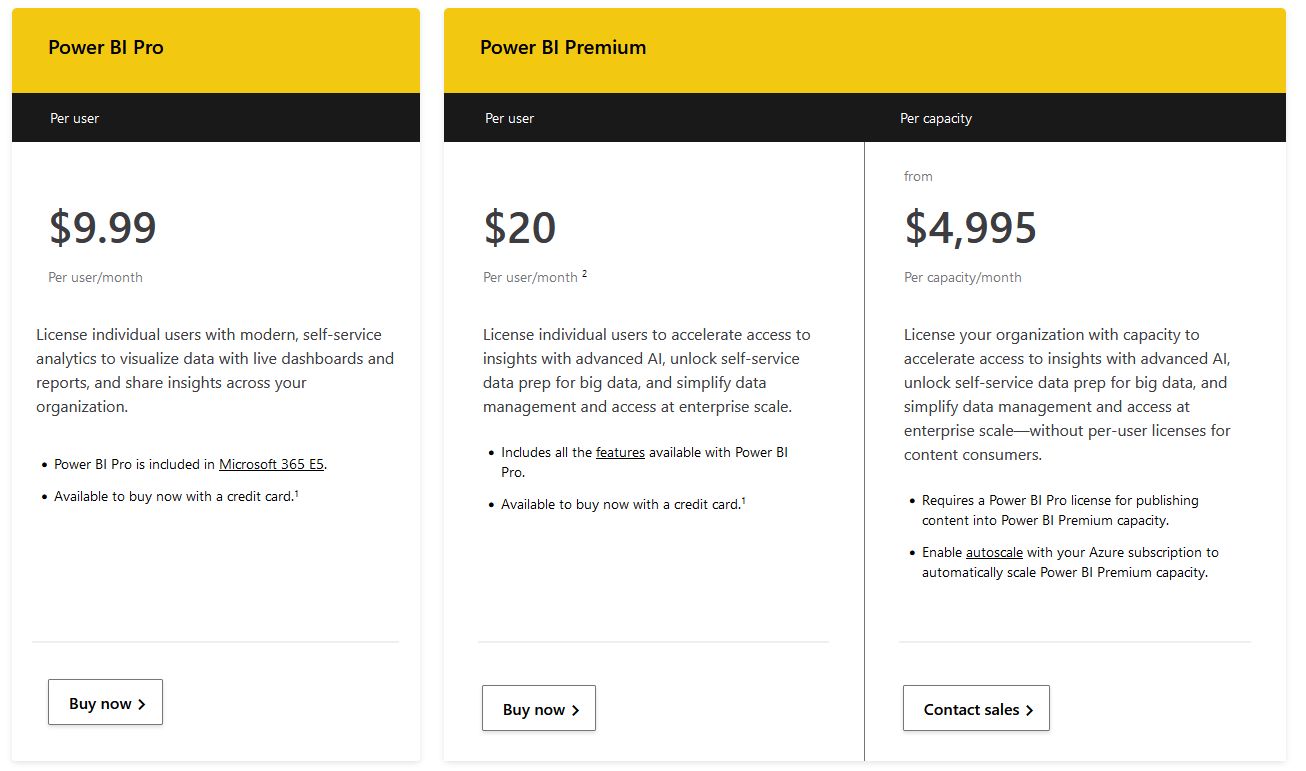
Asides for some marketing differences, the core thing between Power BI Pro and Premium is Power BI Pro has a limit of a data model of 1GB and 8 refreshes per day, so it's a valid option for very small reports and/or companies. The "Per Capacity" option requires to also buy Power BI Pro separately, so it's reasonable from above 500 users. So for most use cases we'll be talking about the 20$/user/month Power BI Premium version.
On the other hand Qlik Sense doesn't have any free version (just a trial, but after contacting sales), and shares just one option on their website, which costs basically 50% more than Power BI Premium.

Ok so Power BI wins this round? Not necessarily. The 30$ option in Qlik is just a basic price for a small/individual customer. The Power BI Services offered above run only on SaaS in the Microsoft cloud, while Qlik gives you an option to choose between SaaS and on-premises. In Qlik Sense you can also get two different types of licenses - one for Developers ("Professional" License) and a much cheaper one for report viewers ("Analyzer" License). While the costs are hidden behind a contact us button, it's well worth to compare, as the price for Qlik is negotiable and is usually related to the amount and type of licenses bought in one package. Microsoft also offers an on-premises option but they do much to make you not want it, requiring a couple more products for it to run, so it's mostly an option for larger corporations.
The machines:
Mentioned a couple of times above, for Power BI as part of the process you need to run a desktop application, and therefore you cannot go with a decade-old laptop and need to invest in a machine with a lot of ram and computing power. You don't have to calculate this step for Qlik, as it may 100% run on the server-side.
The additional services:
Qlik is prepared as an independent tool, created to use multiple-different data sources, Power BI as any other Microsoft product, is created to sell you more Microsoft products. Love it or hate it, you'll most likely have to go with Microsoft Azure at some stage, since the whole Power BI infrastructure is built around it. For Qlik - choose any service you like, or don't choose any at all - since you can build a data warehouse inside of Qlik Sense and don't get any additional costs. To be fair, what's worth noting - a data warehouse in Qlik makes while being easy to set up and maintain, it's not preparing to being shared across multiple different applications but rather for the purposes of Qlik itself.
Total Cost of Ownership
As a brief summary of this section - when calculating the costs, don't take the marketing hook and just the standard pricing, think about the product and its infrastructure as a whole. The Qlik sales team knowing that Power BI is a direct competitor has a couple of documents and tools comparing the details, they're even confident enough as to state that in a 100 users scenario, the total costs of Qlik are 30% lower than Power BI. And honestly, even if it would come down to the costs itself, it would be easier to negotiate with Qlik than with Microsoft.
Design and visuals
The key difference the visuals logic is that Power BI gives you the possibility to change font types and sizes, as well as place objects in a pixel-perfect manner. Colors and other design elements will be familiar to people used to Microsoft Office tools. Qlik on the other hand sticks to a grid-based design, and is taking control of the objects sizing later on.
Asides for the above all of the rest honestly boils down to individual taste of the user interface. Graphically speaking, both of the tools give similar possibilities and components of visualizations, filters etc. As for other customizations, Qlik has some possibility of Themes which can be shared in between multiple reports, and are modifiable via CSS. Power BI has settings similar as in Power Point, where you can download some predefined templates and customize them to your needs.
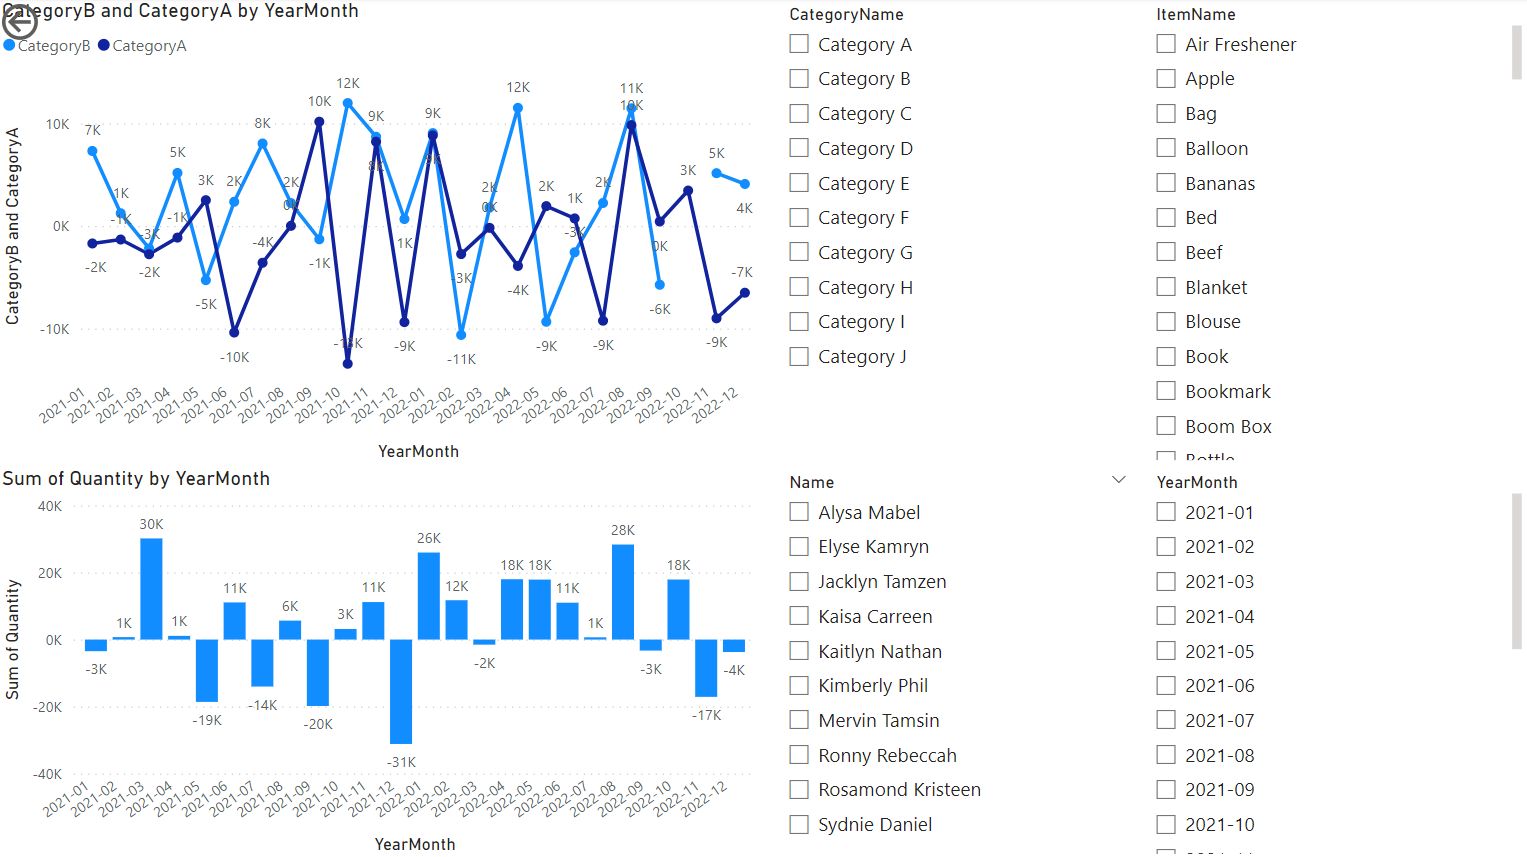
Example of the same basic report with two Charts and 4 filter panes below, both are using standard settings for the components coming out of the box:
Power BI
Qlik Sense

Report Developer Experience
Both tools have some learning curve. Power BI is easier to catch up as its interface will be familiar for anyone who has some familiarity in Excel (and especially its Power Query tool) so it's more beginner-friendly. Qlik while having a harder start, is more rewarding on the long run.
Data loading and transformation:
Basically, Qlik is much more centered around scripting, and Power BI is more centered arount point-and-click giving you all sorts of different menus to choose from, which have their options hidden, but are friendly after reaching some familiarity with them. However when you need to do anything that Microsoft didn't find as a "basic" use case, you need to do some scripting anyways. Scripting in its nature is usually much faster than going through menus, which are just a interface to do the Scripting for you (e.g. each step in Power Query makes a line of script), However while being faster, it requires to be learnt, and is scaring of people used to only clicking through menus.
Both applications have their own scripting language for transformations and measures, Power BI with Dax, and Qlik with its native language. Below there's a example of a function inside a measure calculating a sum of Quantity for 'Catergory A' in both tools:
Power BI: CategoryA = sumx(FILTER('CSV_10m',RELATED('Categories'[CategoryName])="Category A"),'CSV_10m'[Quantity])
Qlik Sense: Sum({<CategoryName={'Category A'}>}Quantity)
Both measures are human-readable. Power BI requires nesting of functions (similar to excel) and Qlik has a simpler syntax but with a broad amount of different brackets which are unintuitive at first sight.
Variable expressions
Power BI has some possibility to input values by the end-user by using editable parameters, but it's nowhere near flexible as what's offered by Qlik. Inside of Qlik a variable can reach any value, be any function, or a function with a parameter. Therefore by taking control over one variable, you can e.g. dynamically change the expression of a function, have it change another variables value etc. This helps with creating more dynamic content, instead of having predefined sheets, and in the long run requires much less time and is more friendly to the end users as an outcome.
The "feel" of the application
Power BI is a tools that somewhat derives from the ever increasing needs placed towards Excel. In its basis, Power BI uses Power Query to do the data loading, which is fine for smaller datasets, as its having a nice preview of what's happening with the data step-by-step, but it's a pain in a more complicated data environment, as it's much slower and the syntax is painful and not something to which programmers are used. The interface needs a lot of clicking through, and while the options are mostly where you'd expect them to be, sometimes what would require writing one line of a script, requires a dozen different clicks, which may be somewhat tiresome. Qlik may be scary at first sight as it's using its own language, and basically most things that aren't visual require some scripting, but it's much faster and more rewarding once you get to know it.
End-user Experience
The core of the experience is quite similar. You have sheets, charts, selectable objects, personal bookmarks etc. But while there are many similarities, there's a couple small, but powerful differences.
The filter pane in Qlik Sense is always on the top of the page and you have easy access to what filters are applied, and can easily change them to other values. The Filters in Power BI are shown only after selecting an object - which tells you which filters are impacting this object, but gives you no possibility to change them from there, you need to go to the specific filter and change it from there. To disable all filters, you need to either go through them one by one, or create a special bookmark without any filters applied. Qlik is encouraging the users more to click through the possible options and see what's inside, and gives you a easy "clear this filter" or "clear all filters" option available always on top, which gives a higher chance of gaining more insights just by clicking through with curiosity.
Selections made on a filter inside of Power BI hide the other unrelated options. Selections made in Qlik highlight the selected options, but show you with color-coding the other possibilityble options, and unrelated options. In this scenario, if you filter a specific Catergory, in Power BI you'll see the related Year-Month, in Qlik you'll see both related and unrelated Year-Months. This may seem insignificant, but when e.g. there's sales missing from this Catergory inside one month, inside of Power BI you won't see this month, inside of Qlik you'll see it in a different color, indicating additional information. More on this topic in a separate article on the Qlik associative engine.
As pictured on the screen below, Qlik gives an option to select data directly from any chart, you can select either one value, or a range of them, which after confirming is applied onto other objects. This option is nowhere to be found in Power BI:

Power BI has native commenting functions to each object, engaging users to leave remarks while reading them. Qlik requires buying an additional product to have this function.
Both Qlik and Power BI have an option to export the data visible on an object. However Power BI exports it as a .csv without formatting, when opened in excel it requires further processing before the values are usable. Qlik exports it as a xlsx remaining formatting and table layout. This is probably a negligence from Microsoft which should be changed in future releases as it doesn't make reasonable sense.
Extensions and Integrations
If in the standard objects you're missing any visualization needed, you have an option to download more. Power BI has "AppSource" and Qlik has "Qlik Garden" both filled with tons of additional extensions. However there are two differences:
- Power Bi has a special window inside of it to easly download visualizations and test them right away with sample data etc. It's simple and fast to use.
- Qlik requires you to download the extensions on a separate webpage and import them to the application and restart it, but gives you not only visualizations, but all sorts of extensions since it allows communication with its engine through an API and supports anything coming through Javasript
As for additional integrations, Power BI easily communicates with other Microsoft products from the Power family, and Azure, but also others. Qlik doesn't link to any other supplier, but gives you development options through its "Dev-Hub" like Mashups, previously mentioned custom extensions (most of which are free, but there are some paid worth noting as well).
Miscellaneous
Updates and future development
Power BI has monthly updates, mostly with bug fixes
Qlik Sense has Quarterly updates, with feature releases, and in the meantime provides patches/build updates with bug fixes
Mobile devices access
Power BI has a dedicated mobile app, and the desktop app gives the possibility to separately design the content of the mobile version of a report giving much flexibility.
Qlik Sense doesn't require any app to be installed, you just need to log in as usual to your Qlik environment via a web browser. On the other side it has a very limited set of options on designing the report specifically to the mobile version.
The commonly agreed full form of the abbreviation QLIK is Quality, Learning, Interaction and Knowledge. In its first years Qlik was Named Quik (standing Quality, Understanding, Information and Knowledge), but later changed its name due to trademark reasons.
Final Thoughts
Both tools have their advantages, but in our opinion Qlik is the winner of this comparison. While Power BI is easier to get into for simple usecases especially since it's offering a free desktop application and has a familiar interface, Qlik is the more refined and specialized tool created and further developed for decades strictly as a Business Intelligence tool and going with it will have much more worthwhile benefits in the long run. As Power BI has a large portion of the market, companies tend to replicate the solution which is more popular, but not necessarily the better choice when giving it more thought and concideration.