Qlik Sense snowflake model
How does it compare with the traditional model?
As winter is just around the corner, and snowflakes are inevitable in most places in the world, lets look into the snowflake model inside of Qlik and its core features.
Traditional SQL-like model
Databases and SQL were first introduced almost 50 years ago in the 70s. No wonder they’re a basis to a lot of applications, which modeled a way around them. This was later-on cultivated by the rise of spreadsheet applications like MS Excel. As a result of this technical background, in most applications its necessary to unify data in a joined table to simplify data treatment. This is either done manually in code, or sometimes in a visual manner connecting the tables by hand. In the latter while the interface shows all of the connections as being separate tables, the application itself does the unification under the hood.
This approach works fine when handling a relatively-simple data model, but can quickly become a bottleneck in matter of performance – doing a lot of joins on a large dataset is requiring a lot of computing power. While this can be overcome either by equipping oneself in patience, or increasing the processing capacity, it can also become a logical issue when trying to data.
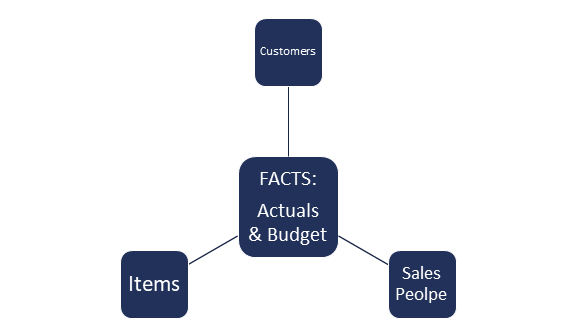
Let us imagine a simple real-world example with reporting a budget and actuals data, along with tables of customers, items, and sales people.
Example dataset:
| Table | Column count | Row count | Dataset [Column * Rows] |
| Budget | 31 | 400 000 | 12 400 000 |
| Actuals | 53 | 1 300 000 | 68 900 000 |
| Customers | 28 | 1 000 | 28 000 |
| Items | 37 | 5 000 | 185 000 |
| Sales People | 15 | 300 | 4 500 |
| TOTAL | 164 | 1 706 300 | 81 517 500 |
In the beginning, in total we’re starting with a dataset of 164 columns and <82milion individual data cells. In a traditional model, you need to repeat the data from customers, items and sales people inside of the Actuals and Budget, and connect them to one another - just to help the program process it through a “flat” table.

The process of pre-calculating all of the data into one table helps with its readability for the machine, but has an downside of artificially increasing the number of records. After joining the data into one table, the amount of data in the set would have tripled from the original < 82 million, up to < 218milion. This results from the fact, that we repeat 80 columns from the dimensions inside of the facts. By this stage we’ve only added three tables in a relatively simple case.
It is worth to note, that as it is with joins in their nature – they can generate duplicates when the data matching is not performed correctly. So to make things an ounce more complicated, lets imagine that the items contain data stating their quantity in the current inventory.
Before Joining:
| Actuals | |
| Item | Sales |
| A | 2 |
| A | 3 |
| A | 56 |
| B | 7 |
| B | 8 |
| B | 15 |
| B | 20 |
| TOTAL | 111 |
| Items | |
| Item | Inventory Quantity |
| A | 856 |
| B | 201 |
| TOTAL | 1 057 |
When this data gets joined inside of the fact tables, it would get repeated for every row inside of the facts, this makes it hell when trying to make a sum of all of the inventory and requires taking extra steps.
After Join:
| Actuals + Items | ||
| Item | Sales | Inventory Quantity |
| A | 2 | 856 |
| A | 3 | 856 |
| A | 56 | 856 |
| B | 7 | 201 |
| B | 8 | 201 |
| B | 15 | 201 |
| B | 20 | 201 |
| TOTAL | 111 | 3 372 |
Qlik was noted on NASDAQ since 2010 untill August 2016, when it was acquired by a private equity firm Thoma Bravo, LLC.
While it’s possible to work around this issue in the traditional model, and this approach has worked wonders for decades, it started back when the datasets were much smaller. The amount of data we work with increases exponentially, and simply speaking – this approach is no longer valid in the modern world of analytics. Instead of working around the limitations, Qlik tackled the issue from the ground up, and the result is the counter-intuitive snowflake.
Qlik Sense snowflake model
First and foremost, in the snowflake approach, you concatenate all fact data into one table. The tables containing dimensions are then stored separately.
This results with the exact same dataset in size as we’ve started with, and all of the calculations are made by Qlik on the fly, whenever needed. This is possible thanks to the Qlik associative engine which handles everything under the hood in a matter of milliseconds, even on much larger datasets.
To be exact, technically speaking by definition at this stage we’re taking about a Star model, not a Snowflake, but from Qlik Sense point of view this definition is just a matter of adding next levels to this model, for example:
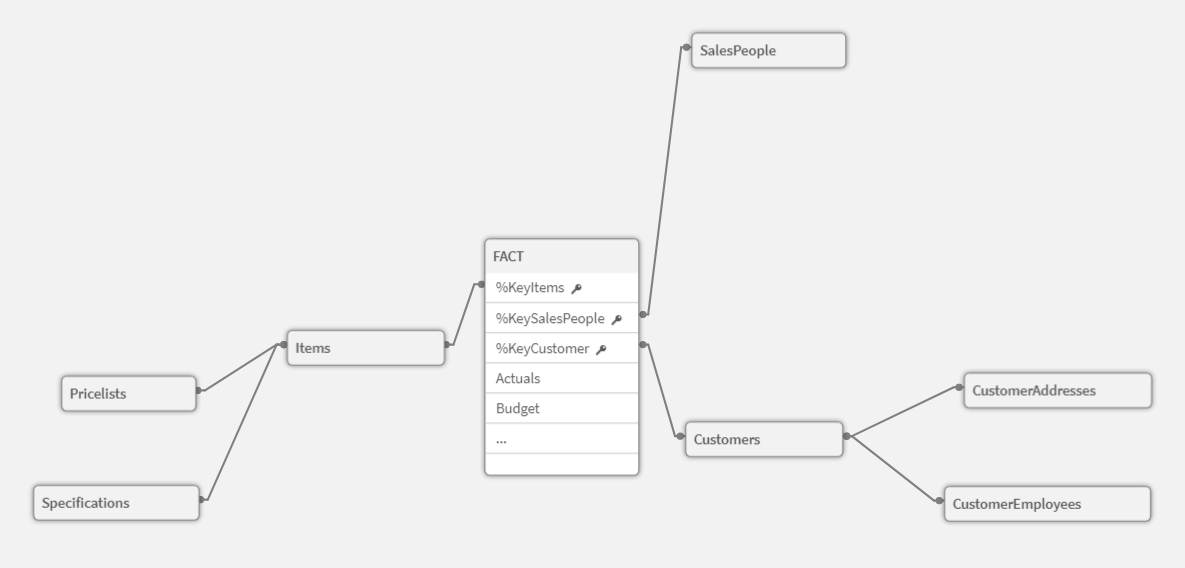
And this can go many further levels down.
While the start or snowflake models aren’t exclusive just to Qlik, a crucial component that makes this an excellent solution is the Qlik Associative model [which we’ll talk about in more detail another time], with one of its key features – when loading the data, instead of doing precalculations and joins as in the traditional model, the engine focuses its computing power on the indexing between data, to make accessing and calculations on them much simpler and faster. It also does some optimizations after each selection being made by the end user.
The best of two worlds
While Qlik works great with the snowflake model, it still can easily work with the traditional model alike, however it usually makes sense just to join part of the model inside of one table to simplify the model without repeating data and/or make complicated calculations work easier inside of code. The freedom is in the hands of the developer to choose the best way to tackle each scenario.
Does it somehow matter to the end user?
The first and obvious thing that the end user will notice is the difference in speed – both in selections, and in the time it takes to refresh an application and its data. But it doesn’t stop there.
A less obvious point is a capability to combine multiple datasets into one application. It can be even ones, that aren’t logically connected in any manner. A real-life scenario would be any management report that overviews the whole company. Why not dare to combine data from HR, Finance, Sales and Purchasing in one place, with the ability to drill down to the individual record? Traditionally it would either require a couple stages of pre-calculation, or the application would be divided into separate ones, as being too slow and/or too expensive to develop.
Qlik doesn’t have issues with mixing apples with oranges while simultaneously being able to separate them on the fly back again to insightful data.